A third-party report on tests performed by European scientists has confirmed anomalous excess heat from Andrea Rossi‘s E-Cat HT, a thermal energy generator based on nickel-hydrogen exothermic reactions developed by Leonardo Technologies.
The Energy Catalyzer first came to public attention in January 2011 when the unit was demonstrated at the University of Bologna in Italy. Since then, in a drive for control, stability and certification, the E-Cat has gone through multiple design changes with the latest version, the E-Cat HT operating at high-temperature.
The tests were performed by scientists from Italy and Sweden who had access to the unit and conducted their investigation independently. The team included:
Giuseppe Levi, Bologna University, Bologna, Italy
Evelyn Foschi, Bologna, Italy
Torbjorn Hartman, Uppsala University, Uppsala, Sweden
Bo Hoistad, Uppsala University, Uppsala, Sweden
Roland Pettersson, Uppsala University, Uppsala, Sweden
Lars Tegner, Uppsala University, Uppsala, Sweden
Hanno Essen, Royal Institute of Technology, Stockholm, Sweden
Data was gathered over two four-day tests, one in December 2012 and another in March of this year. For each test, the E-Cat HTs performed continuously while measurements were taken.
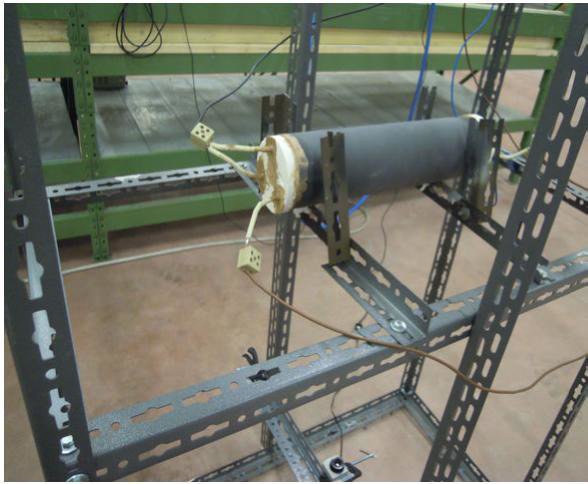
The E-Cat HT operates from an “as yet unknown reaction” in a chamber of hydrogen-infused nickel powder containing some additional catalyst. The nickel powder is enclosed by a hermetically-sealed steel cylinder 3 centimeters in diameter and 33 centimeters long. Surrounding this inner cylinder are resistor coils that heat up the core, initiating the reaction.
 All of this is housed in an outer cylinder made of steel and ceramic that varies depending on the experiment. A thermal camera imaged the surface of the reactor over time, determining the temperature of the outer steel casing.
A first test occurred in November 2012, but that unit overheated, melting the stainless-steel inner chamber. While the data was incomplete, it was clear the reactor made significant heat beyond any chemical reaction. After re-designing the experiments for the second and third tests, computations of Coefficient of Performance (COP) and thermal energy density were strong and impressive.
“The procedures followed in order to obtain these results were extremely conservative, in all phases…. it is therefore reasonable to assume that the thermal power released by the device during the trial was higher than the values given by our calculations”, the report states.
December test gives COP of ~5.6
For the December test, the E-Cat HT ran for 96 hours.
Input power to the heating coils was modulated “with an industrial trade secret waveform”, with the average hourly power consumption used by the heating coils at 360 Watts.
The average thermal Output Power of ~ 2034 +/- 203 Watts assumed a 10% error.
COP
= 2034 Watts / 360 Watts
~ 5.6 +/- 0.8.
Power density, defined as watts per kilogram of fuel, is the ratio of thermal excess power generated in watts to the mass of nickel powder fuel in kilograms.
Excess power is the thermal output power minus the input power. The amount of fuel used for the calculation was 0.236 kilograms, an overweight value that included the mass of the caps of the inner chamber. This over-value for fuel gives a lower limit for power density, so we can assume that the power produced by the E-Cat HT was even greater than that computed in the report.
Thermal Power Density
= (2034 – 360) / 0.236
= 7093 +/- 709 Watts/kilogram, again assuming a 10% error.
Thus, power density is about 7 kilowatts per kilogram of nickel powder fuel.
To get the thermal energy density, the power density is multiplied by the total number of hours the E-Cat HT ran, giving:
Thermal Energy Density
=7093 * 96
~ 681,000 Watt-hours/kilogram
= 681 kilowatt-hours/kilogram
After 96 hours, this unit was shut down to end the experiment.
E-Cat HT2 is self-sustaining
A new generator was employed in the March test, one with a slightly different design called the E-Cat HT2.
The inner reactor core was the same size as the previous one, but an added control system for the E-Cat HT2 allowed this experiment to run in self-sustained mode, whereby the input power is turned off, while the reaction continues to provide output power.
This unusual feature commences with an ON/OFF phase, as described in the report “where the resistor coils were powered up and powered down by the control system at regular intervals of about two minutes for the ON state and four minutes for the OFF state.”
Most of the four-day March test was conducted in this mode where it was shown that the reactor continued to increase heat output “for a limited amount of time” when switched OFF.
Input power to the resistor coils was increased steadily over the first two hours of the test until the ON/OFF mode was reached. After that, input power to the coils then averaged within a range of 910-930 Watts when ON. Subsequent data analysis showed that the resistor coils were on approximately 35% of the time, and off 65% of time over the duration of the test.
Since the control box was estimated to consume 110 Watts, the Instantaneous Power Consumption, the power input when ON, was computed as
Instantaneous Power Consumption
= 920 Watts – 110 Watts
= 810 Watts
But since the input power to the coils was only on 35% of the time, an Effective Power Consumption is computed by
Effective Power Consumption
= 0.35 * 810
= 283.5 Watts
where the authors again assume a 10% error, to take into consideration any unknown uncertainties.
For this experiment, the average thermal output power was approximately 816 +/- 16 Watts, using a computed 2% error.
Thus, total energy produced over the 116-hours March test is then
Produced Energy
= (816 -283.5) * 116
~ 62,000 Watt-hours
= 62 kilowatt-hours
Energy density is off-the-chart
In this experiment the amount of nickel powder fuel mixture was determined by first weighing the inner reactor core cylinder loaded with fuel. Then, the proprietary nickel mixture was extracted from the inner reactor core “by the manufacturer”, and the empty cylinder returned and weighed. From the difference, the fuel amount was computed as 0.3 grams. To compensate for any uncertainties, the authors of the report used a value of 1 gram to compute the power and energy density.

= (816 -283.5) Watts / 0.001 kilograms
= 532,500 W/kg
~ 532 kilowatts/kilogram
Over the full 116-hours March test, the thermal energy density is then computed as
Thermal Energy Density
= (532,500 W/kg)(116 hrs.)
= 61,770,000 Watt-hours/kg
~ 62,000 kilowatt-hours/kg
The energy density of the E-Cat HT2 places it
“about three orders of magnitude beyond any other conventional chemical energy source.”
This thermal energy density for the HT2 is larger than that computed for the December HT test by a factor of three. According to the authors, this this is due to the overestimation of the amount of fuel in the December test, where the steel cylinder caps were included. Still, both E-Cats performed off-the-chart.
For this experiment, the COP is computed as
COP
= 816 Watts / 283 Watts
= 2.9 +/- 0.3 again assuming a generous 10% error
This COP is noticeably different from the COP of the E-Cat HT in the December test of 5.6. This difference is attributed to the fact that the COP tends to increase as the temperature increases.
The average temperature of the E-Cat HT was 438 C while the average temperature of the E-Cat HT2 was 302 C, leading the HT to have a higher COP.
But the authors note that as they did not inspect the nickel powder fuel in either case, so perhaps the disparity in COP may be the result of differences in the two samples.
After 116 hours, the March HT2 test was shut-down and the experiment ended. It is made clear in the report that the fuel was not exhausted, and the tests could have gone on longer, increasing the value of thermal energy production and density.
To quote the report, “… energy densities were found to be far above those of any known chemical source. Even by the most conservative assumptions as to the errors in the measurements, the result is still one order of magnitude greater than conventional energy sources.”
In addition, both tests were monitored for radiation by David Bianchini, and no dangerous emissions were found. Again, from the report:
“The measurements performed did not detect any significant differences in exposure and CPM (Counts per Minute), with respect to instrument and ambient background, which may be imputed to the operation of the E-Cat prototypes”.
This summer, a new test will be conducted for a six-month period. Together with this report, a data set is emerging that proves without a doubt the E-Cat is leading the race for ultra-clean energy-dense power for the people. When global energy policy will catch up with the reality of new energy, no one knows. Congratulations to Mr. Rossi for bringing us one step closer to that free, green, technological future we imagine.
Interesting, but I’m not convinced until all the mystery and secrecy is removed.
They compute that approximately 1g of the fuel was consumed based on the weight before and after the experiment. This might be true if it was made in an open environment (such as burning gasoline with an exhaust pipe). Now it is not certain how much of the fuel was actually used and changed to another material. If you burn gasoline, it seems that nothing is left, but CO2 and H20 gases still have mass. Here the fuel just changes form but still stays inside the container.
“Interesting, but I’m not convinced until all the mystery and secrecy is removed.”
You totally miss the point. Whether it’s 1 gram or 0.3 grams, these scientists saw copious amounts of heat from a tiny chamber. Look at it like a black box if you will – no wires attached! It does not matter to outsiders what was in the chamber, it made heat!
With no CO2, no radioactivity!
The problem is that if they make a huge error like that, can I trust the rest of it? Maybe the measurements are wrong as well? I admit that their most careful calculations seem to indicate a source outside the traditional energy density charts for a closed environment. And don’t say “no writes attached”, because there was the electricity fed to the chamber! I don’t believe this has anything to do with nuclear reactions, in absence of no radiation. Maybe a sort of battery? We don’t know what material was inside the chamber so we don’t know how much energy was required to produce it. Might be more that you get from the heat…
I do not see the error of which you speak.
The wires were attached and monitored by the scientists. If there is something wrong here, then you must believe that these scientists are all colluding with Rossi. That’s just too ridiculous for me to believe. What would they have to gain?
There are no obvious errors here, and certainly no errors with “secret wires”.
Any errors in the methodology will come to light as this report is “peer-reviewed” by the world. Right now, the competency of these half-a-dozen scientists and their report here is good enough proof that this device makes big heat.
The error is in assuming that 0.3g of the fuel was solely responsible for producing the heat, just because their measured that the mass has decreased by that amount during the experiment. If the reaction is chemical, the mass doesn’t change at all at a closed environment. For example, a AA battery gives energy without any change in mass. Furthermore, the 0.3g might be measurement error. Therefore they should have used the whole mass of the fuel to get another lower bound for a chemical reaction. This would be several magnitudes lower than their computations which assume that the measured mass of 0.3g has been converted to energy and the rest of the fuel has remained the same. Does this help you to understand my point?
The report is not “peer-reviewed” according to scientific rigor. The results should be reproducible by other scientists, which is not possible because there is no access to the mystery device.
The “world” has raised questions about the wires. Specifically, it would have been very possible to mess up the measurements of transferred electricity without colluding with the authors.
Jane, This is an enormous amount of heat, way beyond any chemical source.
These scientists had access to the cell and were in control of all the wires.
It is ridiculous to assume there was malfeasance from them, or incompetency.
You are correct on one thing, the report is not peer-reviewed by mainstream science. I imagine they’ll be catching up at some point. Till then, these CMNS scientists are moving forward in attempts to develop the most clean, dense source of power humans are capable of at this time.
They did exactly this, they calculate one energy density using the consumed/0.3g value and come out with an energy density of 3 orders of magnitude above chemical and then they provide a lower limit by considering the entire mass of the cylinder (walls and all!) and come up with an energy density 1 order of magnitude greater than anything chemical. The lower limit is obviously unlikely but provided for exactly this type of question.
What more proof do they need? The skeptics are picking gnat crap out of pepper.
I like the black box view to appreciate the value of what has been accomplished; however it would be interesting to see the results of a series of a few tests wherein the same inner cylinder contained different amounts of the fuel mix so that it could be seen if the power density and energy density calculated were noticeably different. I am wondering if calculating these two values really depends on the total amount of fuel mix in the cylinder or should be calculated using the amount of fuel mix “consumed” [transmuted from nickel to copper] which would likely be difficult to determine given the confidential nature of the fuel mix and difficulty of measuring what the fuel mix change might have been. Of course if only the fuel mix “consumed” was used the two densities would be noticeably higher it seems to me than if the total amounts were used in the calculation.
Stop talking about “energy density” because reaction never stopped because the fuel was used up. It’s only lower limit, high enough to write off any chemical reaction. In reality it is, according to Rossy, higher by many orders of magnitude.
Two tests were performed, one with fuel one without. The reactor with fuel produced heat, the one without no heat. If that won’t convince the skeptics nothing will.
I will not believe that this is not a trick until a filly isolated reactor will show same results without external power consumed.
There are LENR experiments that consume no power, but most all of the do.
Iraj Parchamazad creates excess heat by loading nano-sized palladium into zeolite cavities and then exposing them to an ambient deuterium gas. No other power is used.
But most all the other types of cells utilized power to heat the cell, or to “move” the material at specific frequencies.
The way I read this is that the total weight of the powder was .3 grams.–not the amount consumed. It isn’t clear if the weight difference between the loaded and unloaded cylinder was computed before the test or afterwards but I don’t see anything discussing an amount consumed. Since the test was turned off the true power density is obviously higher than that computed so it is correctly refered to as a lower limit.
I’m not convinced that the calculated power density and calculated energy density are a lower limit of anything. Not enough is known and understood about how the fuel mix functions to contribute to the power and energy generated. For example does the fuel mix function such that the energy generated is distributed evenly throughout the volume of the mixture or are pockets of the fuel mix used here and there. The best way it seems to me to calculate power density and energy density to get a proper value that would be a realistic limit would be to only use enough fuel mix in the cylinder to allow all the fuel mix to be used and the reaction to stop on its own. Then calculate the two densities based on the amount of fuel used i.e. all of it. This might be difficult to do as such a test might take a long time. Again not enough is known about how the process works yet to know how to proceed. Thus several tests need to be done with varying amounts of fuel mixture to get a sense of what is happening to guide how to proceed. If the goal is to determine a more realistic value for each of the densities it seems to me these steps need to be taken. Then one could compare those more realistic values against known values for conventional fuels. The tests run and calculations done already seem to me to far underestimate the true value for the power and energy density for the reactor. I almost get the feeling that the experimenters did this on purpose because if they wrote a report with calculated values closer to what they suspect then the report might not be believed as the results would be way too high and wild. Reputations are at stake here so it would be best to be ultra conservative and not make too many waves. Thus the report should be written so as not to ruffle too many feathers of those who read it and are not already convinced of the LENR process at work.
Let me change the opening sentence
“I’m not convinced that the calculated power density and calculated energy density are a lower limit of anything.”
by adding the word “meaningful” to:
“I’m not convinced that the calculated power density and calculated energy density are a lower limit of anything meaningful.”
The experiment was not measured electrical energy that is supplied to the cell. Therefore, all that is written – is unconvincing.
Maybe the power supply was a huge battery that fueled a cell capacity of 900 watts for five days? What was the size of the power supply? Judging by the photos – there is a whole container.
A. Green, The scientists wrote in the report that the power to the first test cell that melt the interior steel/ceramic chamber was 1000 Watts.
After that, the team reduced the electrical Power In to the resistor coils to 360 Watts for test 2 and 3.
Here is a direct link to the report for you to read:
http://ecat.com/files/Indication-of-anomalous-heat-energy-production-in-a-reactor-device.pdf
Ruby, balanced as usual!
Due to human nature and our “risk aversion” some people won’t accept it until it’s installed in their home! That and financial risk aversion are biased human nature and economics, not science.
Scientific method is based upon unbiased observation, to a practical extent. We have excellent unbiased observation by many scientists who put their careers and reputations “on the line”. This adds to the evidence of hundreds of science reports and even NASA’s head scientist’s cautious endorsements.
Statistically, I’ll estimate we have significant observational proof, possibly as high as 2 sigma or 95%. Two sigma is adequate, even fabulous, for investors but insufficient for widely accepted science theory. Proof of the Higgs boson(Commonly called the God particle) required 6 sigma evidence or 99.9999% evidence. Since we are NOT proving a science theory but are establishing basis for investing and engineering, the evidence is acceptable observational science.
The null hypothesis(that either the effect is not real or fraud was involved) is rejected and further research and investing is advised to strengthen the evidence.
wow Job, you are really jammin my mind with the sigma situation! But I don’t think it’s “risk aversion” that keeps people from accepting this new science and soon-to-be technology. Brad Arnold did a nice article here describing the “thinking” (or not) of those types of minds: https://coldfusionnow.org/the-experimental-investigation-of-the-e-cat-ht-and-heuristics/
It matters not that our legislators and policy-makers have been sleeping on the job. They’ve chosen to ignore this and allow planetary systems to crash. The technology will be released with or without their support.
I can’t wait to have one installed in my home!
what is greater: risk aversion or cognitive dissonance? cynicism, or your soul as a social animal?
“our legislators and policy-makers have been sleeping on the job” How delightfully naive Ruby.
Big Carbon needs Cold Fusion like a hole in the head.
Announcing a new article on the LENR For the Win web site that may be of interest to readers of “Rossi E-Cat HT energy density “off-the-chart”:
“Comparing Energy Sources”
http://lenrftw.net/home/ragone-chart
This article includes a detailed Ragone Chart (specific energy vs. specific power) that:
* is available for use by anyone, anywhere for any purpose
* includes LENR device test results and projected values based on 6 month fuel charges (for the E-Cat HT, E-Cat HT2 and Hyperion)
* includes fission, fusion, chemical, electrochemical and renewable energy sources
The article also provides a characterization of the LENR energy source based on all available information and analyzes the consistency of LENR device test results to date. Many calculations are included so that they can be double-checked and so that the values plotted on the chart are transparent. I think many in the LENR community will find the analysis very interesting… I know I did.
The Ragone Chart from “Comparing Energy Sources” has also been added to the earlier LENR For the Win article:
“Are Low Energy Nuclear Devices Real?”
http://lenrftw.net/home/are-low-energy-nuclear-reaction-devices-real
Feedback is welcome and encouraged.
Hey LENRFTW, thanks for the analysis. Looks like a good read – it’s on my list!
Arthur, you know I’m your “babe in the woods!”