As has been pointed out previously, as developments regarding LENR continue to occur at an increasing pace, and from a growing number of individuals and companies, it is sometimes difficult to keep track of relevant news. In the last article, I tried to bring everybody up-to-date with news regarding Defkalion as they transitioned from Greece to Canada. Now I would like to take a closer look at Brillouin Energy Corporation.
For those who have been following the story closely, there is nothing new to report per se. Many are already aware that Brillouin, as reported first here on Cold Fusion Now, has received a patent for their technology from the Chinese government. They have also entered into a formal agreement with SRI International to further develop and scale up their NHB (New Hydrogen Boiler) technology as the next step towards commercialization. BEC has also negotiated with Sunrise Securities of New York, NY, for a “second stage” $20 million conditional investment agreement. If Brillouin meets the conditions set out in the agreement, which includes making a preliminary agreement to retrofit a small (5-10 MW) conventional power plant, the $20 million investment from Sunset Securities will make Brillouin the most robustly capitalized company in the LENR field.
In this article I would like to bring attention to two presentations given by Brillouin in the last few months. The first is a document the company presented at ICCF-17. Most readers of this site were unable to attend the conference in South Korea and may have missed Brillouin’s disclosure of recent experiments done with Michael McKubre of SRI International. Many have heard of this collaboration but have been unable to look at the data. A PDF of this presentation has been available on-line but many are not aware of it or have not had the access or inclination to view it. With the permission of Robert Godes, CTO and president of Brillouin, I have reformatted the PDF to fit on this web site in order to provide access to a greater number of people. Secondly, at the bottom of the page, I have included a slide show presentation released by Brillouin that outlines the technology and gives an overview of their plans for commercialization. This presentation also includes details of their agreement with Sunrise Securities (see slide #14).
I hope readers find this information enlightening and that it will foster a better understanding of the important and careful work being done by BEC. I hope you will refer interested friends and colleagues to this article for that same purpose.
Controlled Electron Capture and the Path Toward Commercialization
Robert Godes[1], Robert George[1], Francis Tanzella[2], and Michael McKubre2 [1] Brillouin Energy Corp., United States, reg@brillouinenergy.com [2] SRI International, United States
Abstract
We have run over 150 experiments using two different cell/calorimeter designs. Excess power has always been seen using Q pulses tuned to the resonance of palladium and nickel hydrides in pressurized vessels. Excess energies of up to 100% have been seen using this excitation method.
Index Terms– Cold Neutrons, Electrolysis, Electron Capture, Excess Heat.
I. BACKGROUND
We started with the hypothesis that metal hydrides stimulated at frequencies related to the lattice phonon resonance would cause protons or deuterons to undergo controlled electron capture. If this hypothesis is true then less hydride material would be needed to produce excess power. Also, this should lead to excess power (1) on demand, (2) from light H2O electrolysis, and (3) from the hydrides of Pd, Ni, or any matrix able to provide the necessary confinement of hydrogen and obtain a Hamiltonian value greater than 782KeV. Also, the excess power effect would be enhanced at high temperatures and pressures.
Brillouin’s lattice stimulation reverses the natural decay of neutrons to protons and Beta particles, catalyzing this endothermic step. Constraining a proton spatially in a lattice causes the lattice energy to be highly uncertain. With the Hamiltonian of the system reaching 782KeV for a proton or 3MeV for a deuteron the system may be capable of capturing an electron, forming an ultra-cold neutron or di-neutron system. The almost stationary ultra-cold neutron(s) occupies a position in the metal lattice where another dissolved hydrogen is most likely to tunnel in less than a nanosecond, forming a deuteron / triton / quadrium by capturing the cold neutron and releasing binding energy.
This would lead to helium through a Beta decay. The expected half-life of the beta decay: if J_(4H)=0−, 1−, 2−, τ1/2 ≥ 10 min; if J_(4H)=0+, 1+, τ1/2 ≥ 0.03 sec[1]. Personal correspondence with Dr. D. R. Tilley confirmed that the result of such a reaction would be β¯ decay to 4He.
Early Pd/H2O electrolysis experiments used a well-mixed, open electrolysis cell in a controlled flowing air enclosure. The temperature probes were verified to +/- 0.1°C at 70°C and +/- 0.3°C at 100°C. We simultaneously ran live and blank (resistive heater) cells, maintaining identical constant input power in both cells. High-voltage, bipolar, narrow pulses were sent through the cathode and separately pulse-width modulated (PWM) electrolysis through the cell (between the anode and cathode). Input power was measured using meters designed to measure power high frequency (HF) PWM systems. NaOH solutions were used for high conductivity. Differential thermometry suggested excess power up to 42% and 9W (Fig. 4[2]).
II. EXPERIMENTAL METHODS
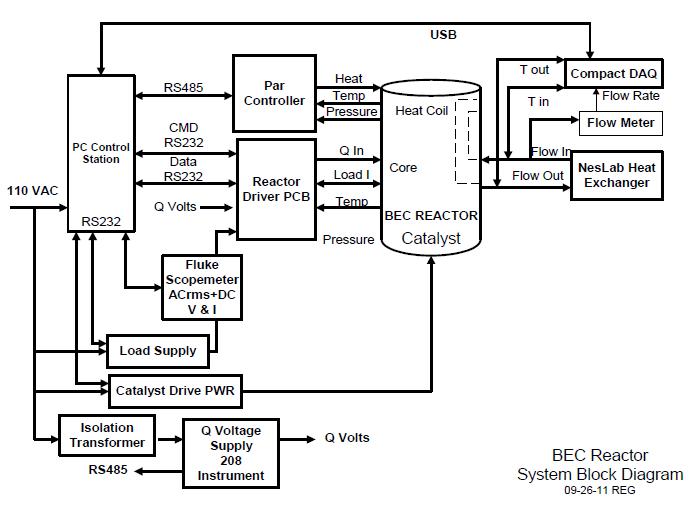
Our recent test data were generated autonomously through the use of a fully instrumented pressurized test vessel that permits much greater control over experiments than was possible using the “open container” test cells from Phase One experiments.
A. Reactor Components
The components of the most recent closed-cell Wet Boiler are shown in Fig. 1.
Those components include:
• A 130bar pressure vessel with a band heater
• A 28AWG (.31mm) Ni 270 cathode
• Ni 270 wire mesh anode
• 0.5 liter of 0.15 to .5M NaOH solution
• Thermal transfer oil coolant loop with a heat exchanger. MobilTherm 603
• Platinum resistive temperature detector’s (RTD’s) measuring input and output coolant temperatures.
• Mass Flow meter in the coolant line.
• An catalytic recombiner , used for safety.
• Resistance heater for calorimetric calibration
B. Power Measurements
We performed conservative measurement of the input power into the reaction chamber and the control board. All inputs, including inductive and logic circuits losses, are counted as power applied to the system All power used for stimulation and control of the cell is measured. The power delivered to the band heater is provided by a Chroma 61602 programmable AC source.
A 100 MHz Fluke 196C oscilloscope meter, operating in “AC (rms) + DC” mode, was used to measure the all input cell power applied to the primary control system. Output power is calculated from the heat removed from the inside of the test cell by pumping an organic fluid (MobileTherm 603) through a heat exchanger immersed in the electrolyte inside the cell. The electrolyte is heated by the stimulation of the electrodes. An external heat exchanger extracts heat from the circulating organic fluid. The net heat in and out is carefully measured and the difference is tabulated. The flow rate is measured by a positive displacement flow sensor (Kytola 2950-2-AKTN). 100Ω platinum RTD’s are used to measure the cooling fluid’s inlet and outlet temperatures, placed just before and just after the cooling loop, respectively. Room temperature in the immediate environment of the test cell is also measured using a 100Ω platinum RTD.
Heat also escapes from the test cell via conductive and radiative loses. Heat flows out of the test cell through the top of the test cell, its supporting brackets to a shelf, and through its insulation. This is accounted for in the software, following extensive calibrations of the cell running with out stimulation pulses (Q).
The bias of the measurement scheme is to under-report thermal output. The electrolysis recombination activity in the headspace of the vessel increases the amount of the conduction and radiative losses at the top of the cell as it heats up and conducts more thermal energy through its mechanical supports. These losses become less significant at higher operation rates as the recombination heat layer moves down to the point where the heat exchange can begin to pick up more of that recombination energy.
C. Cell Calibration and Operation
This system recovers 98% of the heat input by the control band heater alone. The circulating oil is not able to remove all of the recombination energy in the test cell. A significant amount of the recombination energy escapes by conduction through the brackets that secure the cell to the shelf that holds it in place. The method chosen to measure these parasitic heat losses is simple and accurate. The test cell has an electric resistance heating unit called the band heater. The band heater uses a known quantity of watts to heat the entire system to a selected temperature: 70, 80 or 100 degrees C. It takes 132 watts from the band heater to heat and hold the vessel to 70 degrees C with the cooling oil circulating in the cooling circuit. Measurements of the circulating oil show that the oil continuously removes 90 watts at this set point. The difference (delta) is 42 watts and this is the amount heat is “lost” from the vessel by thermal conduction and radiated heat. At 80 degrees C, the calculated parasitic loss figure is 45 watts and at 100 degrees C the parasitic loss is 47 watts.
Using this simple technique, at these three set points the amount of heat leaves the system in excess of that removed by the circulating oil is quantified to calibrate the measurements. This information is used in the data shown in the following slides. Table 1 shows the parasitic heat losses at 70, 80 and 100°C.

The cell/calorimeter is designed to operate at up to 200°C and up to 130bar. The pressurized cell is controlled using LabView® software (National Instruments, Austin, TX, USA) that continuously and automatically collects information about energy flow in and out of the test cell. All experimental data are methodically and systematically archived and recorded to disk. The thermal load due to radiative and conductive losses, in addition to that collected by the heat exchanger, are approximately 400 watts at a vessel temperature of 100°C but can achieve more than 2000 watts at 200°C. The working fluid’s inlet temperature is maintained using a re-circulating chiller (Neslab RTE111).
During operation we have applied up to 800 total watts. The only input to the system is electric power and the only output from the system is heat.
The AC stimulation consists of alternating high voltage positive and negative pulses, approximately 100ns wide, of duty cycles up to 1% or repetition rates of up to 100 KHz
III. RESULTS
Representative results of experiments operated in our pressurized cell/calorimeter are described below. Excess power is defined as the number of watts generated in the cell exceeding that supplied to the cell. The ratio of output to input power is often plotted as percentage.
When the output, for example, is twice that of the input, the amount of excess power is 100%.
The following experiments described herein were designed to measure excess power produced using proprietary electrical stimulation of nickel containing dissolved hydrogen.
A. Experiment 1
Experiment 1 yielded excess power of over 50% for approximately 2 days. Fig. 2 shows the calorimetric results and effect of stimulation frequency soon after 50% excess power was measured in the cell.
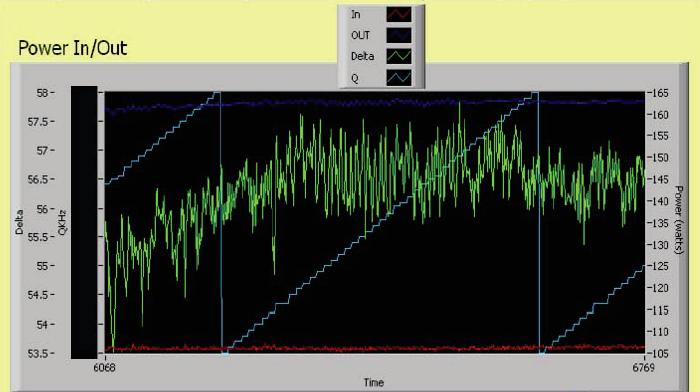
The amount of excess power shown on the screen is approximately 59 %. During this time period there was 107 watts in, 170 watts out, yielding 63 watts excess power, with the cell temperature at 76°C and pressure of 84bar. Approximately 32 watts power was applied to the catalyst and is included in the 107W total input power.
B. Experiment 2
Fig. 3 plots the power and temperature recorded during a complete 66-hour Ni/H2O electrolysis experiment.
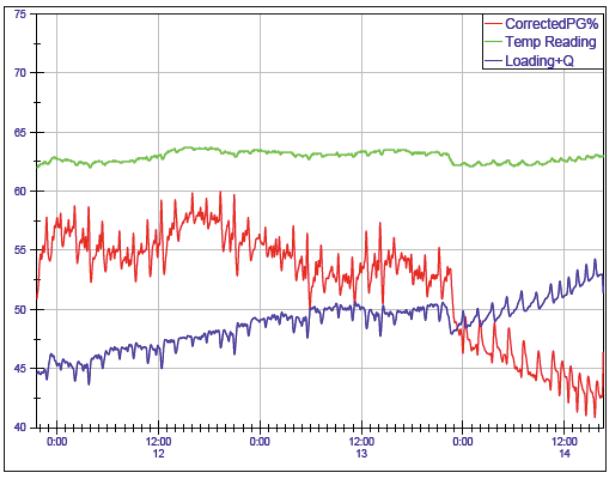
Excess power of over 50% was recorded for much of this experiment. We repetitively swept Q repetition rate while stepping up Q amplitude and then a third parameter affecting Q shape to examine the effects and interplay among them.
The excess heat produced during this run shown in Figure 3 declined as additional power was applied. The red line plots the percentage of excess power, blue the sum of the electrical inputs, and green the temperature of the test cell. The repetitive spikes in the data are due to the cycling of Q repetition rate and the downward sloping trend indicates the increase in power to a change in the shape of the Q pulses. This slide indicates that the level of the production of excess power does not rely exclusively on input power since increasing input power reduced absolute amount of excess power. The automated test system now has the ability to automatically sequence 4 separate input variables. When the Q pulse shape stepped out of an optimal operating point the red and blue plots crossed.
C. Experiment 3
Fig. 4 plots the calorimetric and temperature data for a subsequent Ni/H2O electrolysis experiment.

In this experiment we examined the effect of changing specific input parameters. This plot shows a thermal output 50% greater than input for 14 hours. A gradual increase in temperature tracks small incremental increases in both the DC and AC currents. This continued for 12 hours past the end of this plot as seen in Fig. 5., which shows the sharp response of the system to input power while everything else was held constant.

A jump in excess heat from less than 55% to almost 70% was produced using the settings input during the second half of the experiment on February 15th. Learning from this data, we modified electric inputs to exceed these results.
D. Experiment 4
Fig. 6 plots the calorimetric and temperature data for part of a Ni/H2O electrolysis experiment. While holding total input power constant Q pulse shape was changed, which yielded excess power production in excess of 75% for approximately 11 hours.

After achieving a thermal steady state, the system performed well for the duration of the test. Subsequently a new set of input parameters were utilized in this experiment, after which the excess power peaked at approximately 85% and was above 80% for more than seven hours.E. Experiment 5
Fig. 7 plots the calorimetric and temperature data for part of a Ni/H2O electrolysis experiment.

This was the first time the excess power exceeded 100%, meaning the “watts out” were twice the “watts in.” Certain electrical inputs to the cell were changed deliberately in a proprietary manner effecting Q frequency content.
This experiment is important because it shows both our upward discovery trend and because it exceeded the important 100% milestone. These set of representative experiments showed that we have progressed well beyond the results with the open-cell experiments described in the Background section.
F. Experiment 6
Experiment 6 shows the effect of changing the repetition rate of the high voltage stimulation pulses. Figure 8 plots the input and output powers, percent excess power, and the Q pulse repetition rate. Output power is shown in blue, input power is shown in green, and excess is shown in red as a percentage. The proprietary repetition rate of the pulses is plotted without scale in turquoise.
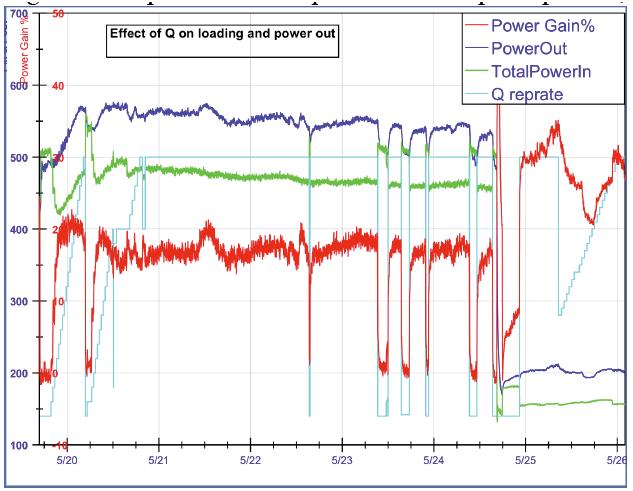
For five days, excess power from the induced thermal reaction in nickel hydride averaged approximately 20% during times when the wave form at a given repetition rate was applied to the nickel hydride. Total applied power was above 450 watts. When the repetition rate was reduced excess power fell significantly, even though the input power rose. On seven different occasions when total applied power to the system was above 450 watts, and the repetition rate was reduced, excess power dropped from approximately 20% to close essentially 0%. Excess power returned quickly to approximately 20% when the repetition rate was restored to its original value.
This plot demonstrates a cause and effect relationship exists between the frequency of the applied waveform pulses (Q) and the amount of excess power produced in the test cell.
IV. CONCLUSIONS
We have demonstrated that the nickel-light-water system is able to achieve more than 100% excess heat production (“2X”). Recent data shows that excess heat production was in the range of 110% for 2 hours.
We ran over 150 experiments using two different cell/calorimeter designs. Excess heat was always seen[3] in experiments where Q pulses, which have been tuned to the resonance of the hydride conductors (“core”), are present. Using our open cell design it is now possible to get excess heat on demand using light water and hydrided nickel and palladium.
Pulsed power in the cathode is the preferred method to raise the energy of the Brillouin zones confining hydrogen nuclei in the metal lattice[1]. We postulate that conversion of this energy to mass, results in the production of cold to ultra-cold neutrons. The removal of charge from the system by absorption of an electron by a proton makes a current pulse the preferred source of pulsed power because it provides electrons for capture.
In all cases, the application of a suitable Quantum Compression waveform enables active hydrided materials to produce excess power on demand without regard to the grain structure. While it is common for “gross loading” systems to work with some pieces of material and not others from the same batch. We believe that the Quantum Reactor technology caused every centimeter in all 15 meters of Pd wire to immediately produce excess heat while exposed to properly pulsed currents in light water. Quantum Reactor technology also allows for significant modulation of the power out of the cell.
Leveraging the results of the open cell experiments, the proprietary circuitry was attached to hydrided conductors in high-pressure, high-temperature systems for the sealed cell experiments[2].
The data taken from nickel-hydrogen system that was stimulated by our proprietary electronic inputs show that the thermal output is statistically significantly greater than the electrical input. Measurable and repeatable surplus thermal output is found in the nickel-hydrogen system when all other inputs to the cells remain constant. We have shown 100% excess energy and hope to achieve 200%, which would make the technology industrially useful. We also believe that the moderately elevated pressure and temperature environment of the pressurized cell may increase the probability for proton-electron captures, than the conditions at ambient temperature and pressure, because the electrolyte can be heated to over the boiling point of the electrolyte at atmospheric pressure. In addition to elevated temperature and pressure, the dimensions of the metal cathode inside the test cell, is much larger than what was used in the “open container”, first- round experiments.
We conclude that the reaction producing excess power in the nickel hydride is related to and very dependent upon the frequency of the Q pulses applied. We have thus demonstrated that there is a repeatable and measurable relationship between excess heat production from the stimulated nickel hydride in the test cell and the repetition rate of the applied electronic pulses. When the repetition rate is changed from the optimum frequency, excess power production ceases in the nickel hydride lattice. When that repetition rate is restored, significant excess power production resumes.
V. FUTURE WORK
We are looking closely at the experimental data from Experiment 5 and will use it to attempt to break through the next threshold 200% (“3X”) hopefully soon.
We have started to perform experiments in a third cell/calorimeter design in collaboration with SRI International that we believe will lead to more useful heat by operating at higher temperatures. We feel that the first commercial applications expected will be hydronic heating systems that require grid power and produce lower quality heat as well as higher quality heat systems that will be used to re-power existing dirty generation assets.
In addition to Pd and Ni, the Q-pulse reactor system should work with other transition metals that confine hydrogen nuclei sufficiently in a lattice to effect electron capture events.
APPENDIX
A. Controlled Energy Capture Hypothesis
p + ~782KeV + e- » n + νe
(using energy for ultra-cold neutrons)
p + n » d + 2.2MeV
(making ultra-cold deuterons and energy)
d + (up to 3MeV) + e- » 2n + νe
(using energy to make di-neutron system)
d + n » T + 6.3MeV
(making tritum and energy)
2n + d » 4H + (?MeV)
3n + p » 4H + (?MeV)
(making short lived 4H nuclei and energy.)
4H » 4He + β¯+ νe + (17.06 to 20.6)MeV
(making helium and lots of energy)
REFERENCES
[1] D.R. Tilley and H.R. Weller
Energy Levels of Light Nuclei A = 4
http://www.tunl.duke.edu/nucldata/ourpubs/04_1992.pdf
[2] R. Godes, “Brillouin Energy Corp. Phase One Data,”
http://brillouinenergy.com/Docs1/Phase_1-VerificationData.pdf.
[3] R. Godes, “Quantum Reactor Technology, Exciting New Science, Potential Clean Energy Source,”
http://brillouinenergy.com/Docs1/BE25Tec.PPS.
[4] R. Godes, “Brillouin Phase II Data,”
http://brillouinenergy.com/Docs1/Brillouin_Second_Round_Data.pdf
Brillouin slide show courtesy of BEC via Slide Share

“Excess energies of up to 100% have been seen using this excitation method…We are looking closely at the experimental data from Experiment 5 and will use it to attempt to break through the next threshold 200% (“3X”) hopefully soon.”
So what?
In the ebook “Secrets of E-Cat,” (Consulente Energia Publisher, 145 pages, 68 illustrations, Pdf format, 7 €, http://www.consulente-energia.com/cold-fusion-book-secrets-e-cat-by-mario-menichella-secret-ecat-andrea-rossi-focardi-energy-catalyzer.html ) author Mario Menichella says:
“In Siena, in fact, the three scientists – using hydrogen and nickel as the two only “ingredients” of the reaction, plus an appropriate amount of heat supplied to the system – managed to get out a double thermal energy than the electrical energy provided in input.”
That was in the early 90’s.
Robert Godes has been working on his technology since the 1990s. The work is meticulous and well-documented, and the reaction is highly reproducible. Mr. Godes understands the mechanism of the reaction and the physics behind it. Also, as far as I know, he pioneered the use of the radio frequency generator. I am sorry if the COP disappoints you but to say “so what” to this important research is, quite frankly an insult. Some people like to get excited about the “hype” of other researchers but the more prudent like the careful and comprehensive nature of the work being done at Brullouin.
I would also like to point out that Piantelli, the father of Ni-H systems, who has been working on his technology since 1989, reports a COP similar to BEC. I doubt that many people would say “so what” about the work of Piantelli, a pioneer in the field.
Could helium be produced in the following reactions?
H(1) + Ni(61) > Co(58) + He(4) 0.489 MeV
H(1) + Ni(62) > Co(59) + He(4) 0.345 MeV
H(1) + Ni(64) > Co(61) + He(4) 0.663 MeV
Excellent update… thank you.
About a year ago I noticed Rossi mention radio frequency generators and that a leader in the art of cavitation was present at the 1mw test.
Seems that the ‘harmonic convergence’ is upon us… in the lattice so to speak. I don’t know physics… which is obvious to those who do, I apologize for any of my misconceptions yet I do so see a pattern emerging here of what… works.
My 11/23/11 post is reprinted here for you to ponder.
A bit of research and I come across this item. Rossi is associated with these folks who are experts in the cavitation phenomenon.
http://pesn.com/2011/11/05/9501947_Cavitation_as_a_Purification_Panacea/
Different frequencies of sound may cause cavitation and focus heat within the nickel and hydrogen lattice, specific frequencies oscillating through a harmonic may create standing waves weakening the lines of resistance between subatomic particles. Is sound the catalyst in the Rossi E Cat reaction chamber? Related information see Sonofusion http://en.wikipedia.org/wiki/Sonofusion
Are the radio frequencies creating a micro-cavitation within the nickel hydrogen lattice? This is the first post I found where Rossi mentions radio frequency generation as part of the reaction process.
“In the self sustained mode, a one megawatt plant can operate at full power, while consuming a miniscule amount of electricity to operate fans, pumps and radio frequency generators.” http://www.leonardo-ecat.com/fp/Products/1MW_Plant/index.html
Further harmonic speculation in a recent CBS News article “Cold Fusion Debate Heats Up After Latest Demo” By Natalie Wolchover
“Peter Hagelstein, an MIT professor of electrical engineering and computer science and one of the most mainstream proponents of cold fusion research, thinks the process may involve vibrational energy in the metal’s lattice driving nuclear transitions that lead to fusion.” .www.cbsnews.com/8301-205_162-57318762/cold-fusion-debate-heats-up-after-latest-demo
To BRILLOUIN technical manegement,
Could the presence of negatively charged hydrogen ions in the reactor containing nickel and hydrogengas bring an opportunity to have energy-producing reactions ? See the possible role of said ions in the E-Cat reactor of Andrea Rossi discussed on the e-Cat Site under “Cold fusion catalyst”. Best wishes.
Perhaps a two step reaction is taking place in H-Ni LENR to make helium.
P + Ni(N) > Cu(N+1)* Step1
P+ Cu(N+1)* > Ni(N-2) + He(4) Step 2
________________________
Over all
2 P + Ni(N) > Ni(N-2) + He(4)
For example:
P + Ni(64) > Cu(65)* Step1
P+ Cu(65)* > Ni(62) + He(4) Step 2
________________________
Over all
2 P + Ni(64) > Ni(62) + He(4)
Cu(N+1)* is copper in an excited state.
PS
2 P + Ni(64) > Ni(62) + He(4) 11.8 MeV
PS
Think of it this way. Nickel hydride (NiH2) sucks up a proton to become cupric hydride in an excited state (CuH*) and then cupric hydride sucks up a proton to become zinc in an excited state (Zn*). The zinc decays into a lower isotope (two neutrons less) of nickel (Ni) and helium (He).
NiH2 > CuH* > Zn* > Ni + He
PS
Just to complete the thought using palladium. Palladium deuteride (PdD2) sucks up a deuteron to become silver deuteride in an excited state (AgD*) and then silver deuteride sucks up a deuteron to become cadmium (in an excited state (Cd*). The cadmium decays back into the original isotope of palladium (Pd) and helium (He).
PdD2 > AgD* > Cd* > Pd + He 24 MeV