E-Cat World has obtained an English translation of the report by Professor Alexander Parkhomov originally published in Russian detailing his replication of Andrea Rossi’s E-Cat generator.
Download the report here:
http://www.e-catworld.com/wp-content/uploads/2014/12/Lugano-Confirmed.pdf
Parkhomov writes that “the reactor is capable of generating a lot of heat in excess of electric heating”. With the E-Cat replica testing at temperatures between 1200C-1300C, the unit provided a COP of about 2.6.
However, Fig.6 of the report shows a so-called heat-after-death effect, whereby after the heating input is turned off, the reactor continues to maintain its temperature for approx. 8 minutes before dropping lower. This unique effect, when utilized fully, will allow infinite COP as there is zero input power while output power stays strong.
Fig.5 shows that no radiation beyond the normal background radiation was detected.
The English-version of Parkhomov’s report is reproduced below:
BEGIN REPORT ***************************************************************
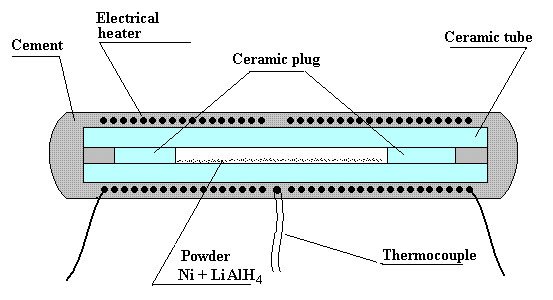
1. The design of the reactor.
For the manufacture of reactor Al2O3 ceramics tube length of 120 mm, an outer diameter of 10 mm and an inner diameter of 5 mm is used. The tube is rounded by electric heater. Inside the tube it is 1 g Powder Ni + 10% Li [Al H4]. The thermocouple contacts to outer surface of the tube. The ends of the tube are sealed heat-resistant cement. Likewise the entire surface of the reactor is coated by heat-resistant cement.

Used by experts at verification Rossi reactor technique based on thermovision camera observation is too complex. In this experiment a methodology based on the amount of water boiled out is used. This technique is repeatedly checked. In this experiment the reactor is inside of closed metal vessel. This vessel immersed in the water. When the water boils, part of it is removed as a vapor. By measuring the decrease of water, it is easy to calculate the separated heat because the value of the evaporations heat is well-known. Correction for heat loss through the insulation can be calculated as cooling rate after shutdown reactor.
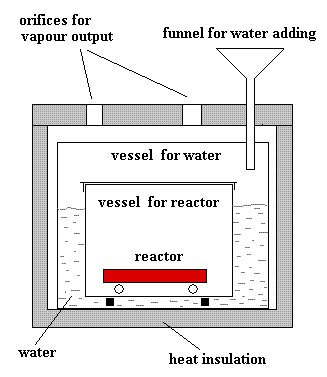
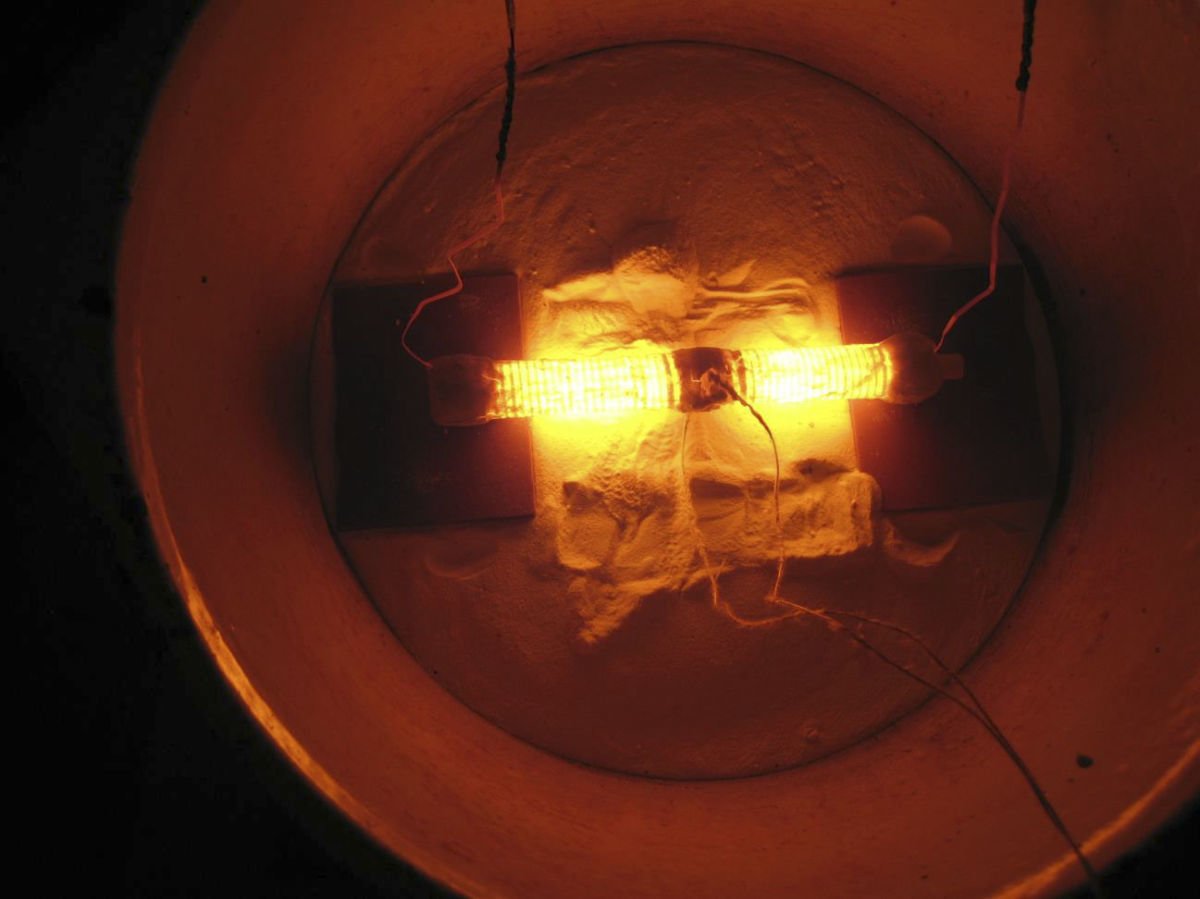
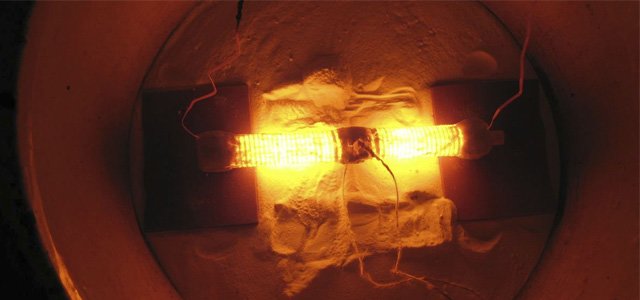
Fig. 4. The reactor in operating time. The covers from a thermal insulation and vessel with the reactor are removed
2. Outcomes of the experiment
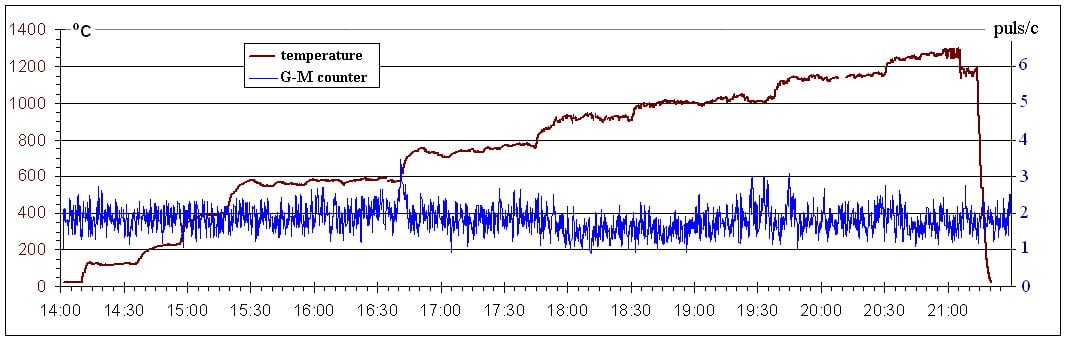
The power supplied to the heater stepwise varied from 25 to 500 watts. Level of 1000°C was overcome after 5 hours of heating. On the same diagram shows the count rate Geiger counter SI-8B. This counter responsive to alpha, beta, gamma and X-rays. It is seen that all during heating, the radiation situation is not very different from the background. A slight increase in temperature is noticeable only about 600°C to 1000°C. Further studies have shown that this chance or regularity. Dosimeter DK-02 is not found during the experiment set dose within the measurement error (5 mP)
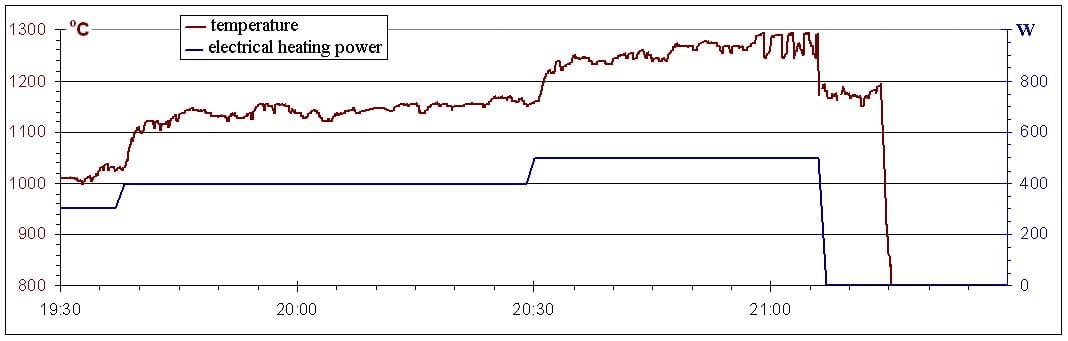
Here is shown in more detail the temperature change of the heating power 300, 400 and 500 watts. It can be noted that for the same heat output there is a gradual increase in temperature, particularly strong in the last site. At the end of the site with the highest temperature there are the temperature oscillations. This section ends with the termination of electric heating as a result of heater burnout. Thereafter, at the temperature for 8 minutes kept at nearly 1,200°C, and then begins to fall sharply. It is indicates that in the reactor at this time heat is produced at kilowatt without any electric heating. Thus, from the already seen that the reactor is capable of generating a lot of heat in excess of electric heating.

At temperatures 1150°С and 1200°C – 1300°C, the heat release of the reactor considerably exceeds consumed energy. During activity in these modes (90 minutes) over the consumed electrical energy about 3 МДж or 830 Wh is produced. Output Experiments with analogue of high-temperature Rossi heat source, loaded with a mixture of nickel and lithium aluminum hydride, showed that at temperatures of about 1100°C or higher this device produce more energy than it consumes.
END REPORT*****************************************
Related Links
Interview with Andrea Rossi on the new Hot Cat test report with John Maguire
Ruby, this a beautiful, elegant post that is great news!
Thank you Ruby for all your work over the year helping to bring Cold Fusion into the World.
Happy New Year to you all.
George
Could it be that Al2O3 of the ceramic reacts with Li[AlH4] in exothermic way? To avoid this put the “fuel” in a platinum envelope and repeat the test.
It should be a calorimetric report, we need to have ratio between input and output energy. Yet it only talks about temperature and input energy. Why? Is this report being deliberately ambiguous on the ratio?
The Time based graphs are published. Perhaps you would like to do the honours and intergrate them to convert power into joules. (dp/dt)
I struggle to contain my excitement.
Does anyone have a clue what this means?
(Wild speculative moment- – Is this the reasl reason for the fall in oil prices? Probably not.)
whats the ratio of Ni and liAlH4 used
No signs of a nuclear reaction have been detected. The change in isotopic ratio in the nickel and other elements such as lithium has not been searched as in the Lugano report. Is there a nuclear reaction? or is it
an exothermic oxido-reduction reaction with hydrogen and oxygen present in the Al2O3 containing ceramic envelope.? More has to be found to convince me of the positive COP.