[latexpage]In 1989, Drs. Martin Fleischmann and Stanley Pons announced results of their largely self-financed research into palladium-deuterium electrolytic systems. In one of the early patent applications, they included a graph documenting the surprising increase in temperature of a cell over time.
This graph is taken from Dr. Michael McKubre‘s public talk What happened to cold fusion?
As a scientist involved in this research since that very day back in 1989, Dr. McKubre described some of the main features of this graph.
“This result, by itself, with no more explanation really, is sufficient – if you believe Martin Fleischmann – to convince you that there is a real thermal heat effect in a deuterium-palladium system.” -Michael McKubre
Acknowledged as one of the greatest electro-chemists that ever lived, there was good reason to accept Dr. Fleischmann’s, and his partner Stanley Pons’, data.
In the graph, the temperature begins in the upper-50s$^{circ}$ C, and then begins to increase at a steady pace, represented by the slowly climbing line in the graph, as their electro-chemical cell is held at constant power.
“You see the little downward spikes in the rising areas”, said Dr. McKubre, “Fleischmann and Pons ran their electro-chemical cells open, that is, the products of electrolysis, in this case deuterium D2 gas and oxygen O2 gas, leave the cell, so they have to refill the cell every so often with the amount of heavy water that’s left. So these downward spikes are the times once each day when heavy water was added to the cell to make up for lost electrolytes.”
In their paper that circulated after the 1989 announcement, some of the early Fleischmann-Pons experiments that created excess heat were described.
… standard additions of 1 ml of the electrolyte were made following sampling. Losses of D2O due to electrolysis in these and all the other experiments recorded here were made up by using D2O alone. A record of the volume of D2O additions was made for all the experiments.
—Electrochemically induced nuclear fusion of deuterium, J. Electroanal. Chem., 1989
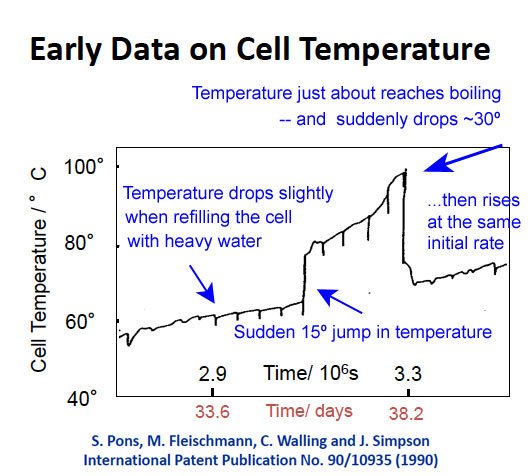 The steady increase in temperature, punctuated by small, temporary drops, continues for days. Dr. McKubre relayed what happened next,
“All of a sudden, one day it goes down alot, and then it kicks up to a new level – it kicks up in temperature by 10 degrees or more. So all by itself, at constant input power, steady operating systems, the cell suddenly started to produce 15 degrees more temperature. There’s clear evidence of excess heat and it builds.
It builds up asymptoting at 100-degrees Centigrade, so it comes up very close to the boiling point, and then all by itself – and this all-by-itself is why its taken us twenty-two years to understand this thing – the cell switched off and went back to its initial trajectory.” -Michael McKubre
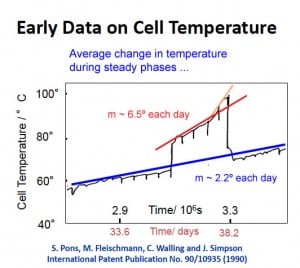 When the temperature “kicked-up”, the rate of change increased to about 6.4$^{circ}$ C higher each day, and rose parabolically as it got closer to boiling. After the big drop, the rate of temperature increase returned to about 2.2$^{circ}$ C each day.
What caused these sudden temperature increases, and temperature drops, has occupied scientists for the past 23 years.
“This is an electrode being electrolyzed in a heavy-water electrolyte”, said McKunbre, “a palladium cathode, the negative electrode. The line is rising, the temperature is going up in the cell at constant power. Now, electro-chemical cells will generally rise in voltage, so that’s not necessarily surprising or interesting.”
“All you need to do is wrap a calorimeter around that and measure the amount of heat to determine whether this is possible by any chemical scheme or not. And the answer is it’s absolutely not possible by any chemical scheme. This amount of heat is 100 or 1000 times more than you could get from the sum of all possible chemical reactions in that particular experiment.” -Michael McKubre
In his 2007 summary of cold fusion research The Science of Low Energy Nuclear Reaction, Dr. Edmund Storms described one early FP experiment using a 1-cm cube of palladium which “melted through the beaker and bench after an explosion stopped the current.” [p 128] In their initial paper, the Fleischmann-Pons team wrote “WARNING! IGNITION?” for that particular run. Had they experienced “heat after death”, a phenomenon whereby the cell keeps on generating heat energy even after it’s been unplugged, and the current to drive electrolysis is no longer applied?
The control of this particular reaction leads directly to “self-sustain mode” in the newer nickel-hydrogen gas-loading steam generators, leading to huge thermal energy returns that are safe and clean.
“This [early data] was available for discussion and interrogation”, said Dr. McKubre. “Thoughtful people looked at it and said, ‘My god, how can that possibly happen?'”
Unfortunately, for various reasons, some of which Dr. McKubre discusses in the lecture, many bright scientists did not reproduce the results. Dr. Edmund Storms related the irrationality of the broader scientific community in accepting their negative conclusions over the positive results.
“Accepting these negative studies as evidence against anomalous power being real would be like having many groups each collect random rocks from a beach, have the sample carefully tested for diamonds, and then when only a few diamonds are found, conclude that diamonds do not exist anywhere in nature because the observations could not be reproduced when other random rocks were examined. Such an approach would be considered absurd in any other field of study, yet it was applied to claims of Fleischmann and Pons.” Edmund Storms The Science of Low Energy Nuclear Reaction [p 52]
This early data “was preliminary, as Fleischmann and Pons readily acknowledged”, and they had not at the time intended to make it public. Yet, it was this early data and graph that “triggered” all the work in the newly created field of condensed matter nuclear science since.
Dr. Storms wrote,
“Nevertheless, the excessive response encouraged intense studies in many laboratories and a willingness of a few scientists to acknowledge anomalous results. Without this over-reaction, such unexpected behavior would have been completely ignored as error. Instead, people were encouraged to report behavior thought to be impossible-behavior that now has been witnessed hundreds of times in dozens of laboratories.” Edmund Storms The Science of Low Energy Nuclear Reaction [p 62]
This Early Data graph was dismissed by the mainstream science minds of the day. The small group of researchers around the world who continued to investigate the anomalous heat generated by these simple electrolytic chemical cells have done so despite isolation and derision from their less-than-curious peers. Now, major advances in this field are leading to commercial products which hold the promise of changing all planetary systems, social, economic, and ecological.
As this field develops from an obscure science to a worldwide technology, this graph represents a turning point, when humanity was given a second chance for a peaceful future, with clean, abundant energy for all, even if nobody knows it yet.
Cold Fusion Now!
Related Links
SRI International: What happened to cold fusion? (See part 2 of the video for the Fleischmann and Pons Early Data) by Ruby Carat November 21, 2011
The Science of Low Energy Nuclear Reaction by Edmund Storms published by World Scientific
Would you bake crushed up sea shells and clay in a glass-blowers oven? Of cause not! Only the insane would.
Well, you just passed up on cement.
What on earth caused Pons and Fleishmann to do such an experiment? There lies the true genius of their work.
True scientists dance along the edge of insanity, exposing themselves to the void of the unknown.
I am awe inspired.
Would I detract from that beautiful poetry by saying that there was a long history of experiments whereby the metal palladium was infused with hydrogen? Palladium can absorb 900 times its volume in hydrogen.
Cement!
Is this enough evidence for our politicians or will China be taking the LENR lead?
Sadly, at the rate things are going, at this point I would have to put my money on the Chinese.
NIce write-up Ruby.
Places that have less hardware development will assimilate a new technology faster. The industrial infrastructure in the US may mean we are the last to get this new technology.
and …..thanks!
Yeah Ben, I’m afraid so.
The thing is they’re too stupid to see that this is unstoppable. They think it’s the 1950s. “Be impressed with our credentials and shut up.” just doesn’t work anymore.
I was given a great explanation for why people are so reluctant to believe in LENR:
If people were told that a cell phone would be the size of a quarter, with artificial intelligence, they would tend to believe that incredible thing because they are familiar with cell phones already. On the other hand, if they are told that LENR will replace fossil fuel and make electricity so cheap you won’t have to meter it, that is without precidence. Similar to the Wright brothers, and the problem of people believing their claim.
It looks like Rossi or Defkalion will have to mass produce LENR home generators for LENR technology to intrude upon the public’s mind. Until then, regardless of the energy activists like me put forth, we are just whistling Dixie. I doubt even Defkalion’s offer for independent verification work in getting general acceptance of the validity of LENR.
1. That unknown residue puzzling researchers for centuries after a chemical reaction product is separated by distillation, crystallization, etc.
Answer: Perhaps “Quantum Mechanics Tunneling”, or maybe side reaction but the focus is on the product.
2. “We also notice a broad exothermic peak …” See: http://144.206.159.178/FT/537/11592/13897082.pdf
Answer: Perhaps, perhaps, perhaps … but focus on Ni catalyzed preparation of MgH2 from elements for industrial production. (Part of my objectives while employed at Metal Hydrides, Inc., Beverly, MA in 1955 not to mention a pilot plant explosion investigation which yielded no clue as to the cause.)
The mysteries of the hydride ion, proton, H2 and ionic hydrogen give up their mysterious secret properties slowly.
Thank you Ruby for focusing on the incredible events of this new age of mankind. The controversial debates which rage are a boor. The era has produced many outstanding people such as Rossi, Guglinski, et al and you Ms Carat. May you never be distracted by the doubters or tempted to contribute to their unsuccessful quest for an ego boost. Focused progress, not perfection is a primary tenant of a researcher.
Louis Tengzelius
Borrowing Dr. Swartz’ phrase, let it be said we had “the guts to study cold fusion”!
I hope I’m not putting my ignorance on display here but I believe the experiment was run at a constant current not power. As the experiment proceeded contaminants in the electrolyte are deposited on the palladium causing the resistance of the palladium to increase and thereby cause an increase in the power delivered to the system with the current constant. Power = I * R^2
I believe you are correct, Zed. Dr. McKubre was most likely using the words *loosely* for a general audience. I appreciate you reading carefully though. I use so much slang and loose language, I should be writing poetry instead of science articles!